On this page
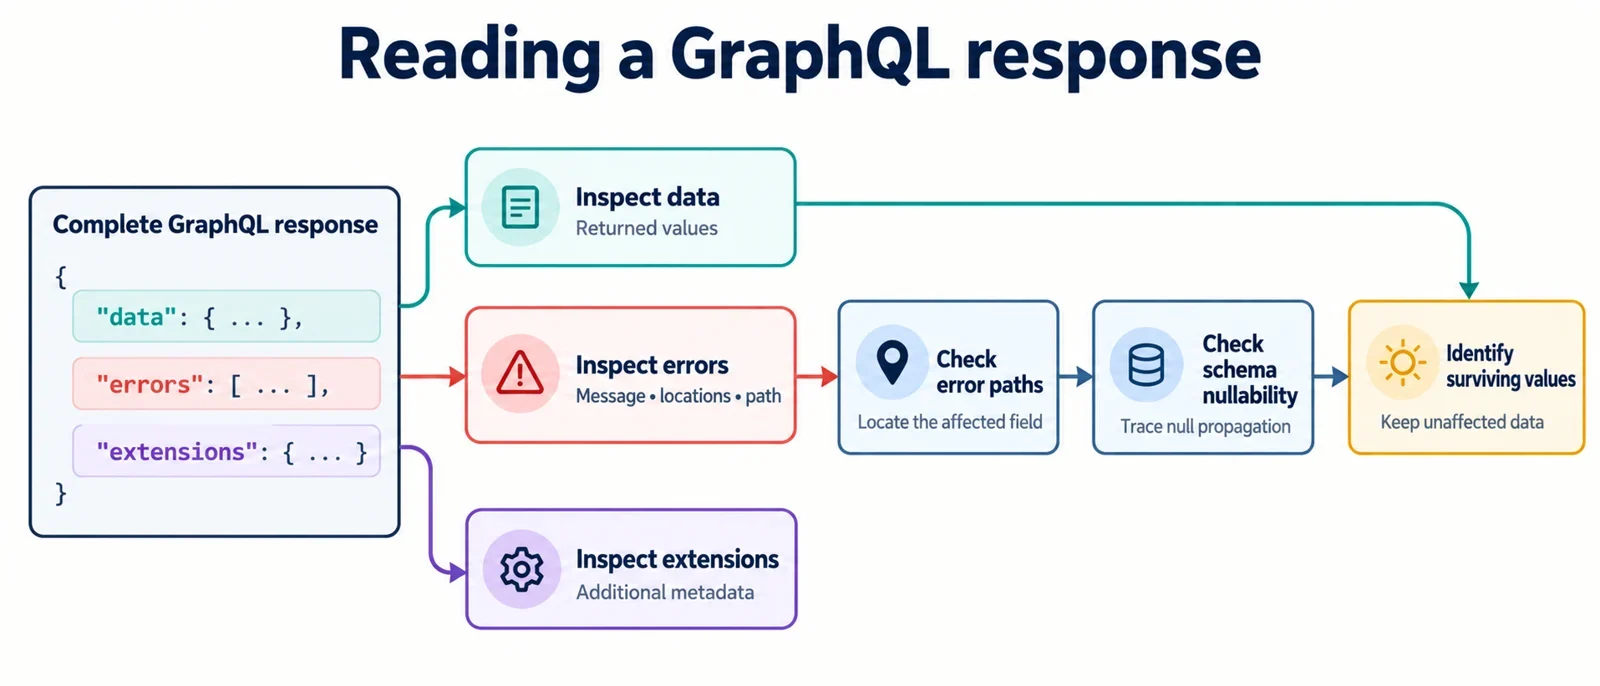
Start by formatting the complete response, then inspect data and errors together. A GraphQL operation can return useful values even when field execution encounters errors. Keeping the result and its diagnostics visible gives you a better basis for deciding what the application can use and what still needs investigation.
Use escentmachine’s JSON formatter to make the response easier to read. Formatting is one step in the investigation: it does not validate the GraphQL operation or explain the server’s execution behavior. The examples below are synthetic inspection exercises. Their field names, identifiers, messages, and diagnostic values are illustrative; verify path interpretation and null propagation against the schema and documentation for the server you are inspecting.
Format the complete response
Keep an unchanged copy of the original response before formatting it. Include the entire object: data, every entry in errors, and any additional response metadata. When extensions is present, the response explanation describes it as an object.
Synthetic input: example B
This example represents a response in which the first deletion returned an identifier and the second deletion failed:
{"data":{"firstDelete":{"id":"item-17"},"secondDelete":null},"errors":[{"message":"Second deletion failed.","locations":[{"line":4,"column":3}],"path":["secondDelete"]}],"extensions":{"inspectionLabel":"example-b"}}
Expected indented output
{
  "data": {
    "firstDelete": {
      "id": "item-17"
    },
    "secondDelete": null
  },
  "errors": [
    {
      "message": "Second deletion failed.",
      "locations": [
        {
          "line": 4,
          "column": 3
        }
      ],
      "path": [
        "secondDelete"
      ]
    }
  ],
  "extensions": {
    "inspectionLabel": "example-b"
  }
}
The expected change is indentation. Check that the identifier, explicit null, error message, location values, path entries, and extension value remain intact. This example contains one error; a real response may require inspecting several entries individually.
Successful JSON parsing establishes that the input can be read as JSON. It does not establish that the GraphQL document is valid, that execution completed successfully, or that the returned values satisfy the application’s needs. Those questions require examining the operation, response, and relevant schema information.
Read data and errors together
The data key contains the result of the executed operation. The errors key contains information about raised errors. Read both before deciding whether the response supplies a usable result.
Compare three response shapes
Example A is a synthetic successful response:
{
  "data": {
    "firstDelete": {
      "id": "item-17"
    }
  }
}
Example B, shown above, contains both returned values and an execution error. Partial data can remain when errors arise during field resolver execution, and GraphQL attempts to continue executing other fields after a field error.
Example C represents a request error raised before execution:
{
  "errors": [
    {
      "message": "The request could not proceed to execution."
    }
  ]
}
| Observation | What it contributes to the investigation |
|---|---|
| Example A contains a result and no error entries | Inspect the returned values against the application’s requirements. |
| Example B contains values and an execution error | Some results survived; investigate the failed part alongside them. |
| Example C represents a request error before execution | The response has no data property. |
A response explicitly contains "data": null |
The property exists with a null value; inspect the diagnostics and execution behavior to explain it. |
An absent property and an explicit null value are different observations. Preserve that distinction in notes, bug reports, and comparisons. Replacing an absent data property with null during preparation would erase evidence from the original response.
Trace each error to its affected field
Start with the error’s message, which supplies information about the kind of error raised. Then retain its complete path, if one is present, and investigate how that value corresponds to the operation and returned data.
In example B, the message describes the second deletion and the synthetic path contains "secondDelete". The response also contains a field with that name. This gives you a concrete branch to examine. Confirm the relationship using the submitted operation and the server’s documented path behavior before turning the observation into a general traversal rule.
Check aliases and list entries explicitly
A more complex captured diagnostic might contain a value such as:
{
  "path": ["recentItems", 1, "title"]
}
Before navigating automatically, establish the conventions that apply:
- Does the path use a response alias or the field’s schema name?
- How are list positions represented, and what indexing convention applies?
- How should traversal proceed when an intermediate returned value is null or absent?
These answers determine whether a proposed lookup reaches the intended branch. Keep the original path unchanged while recording the interpretation separately. If you cannot confirm a convention, record the unresolved question instead of silently selecting a field or list entry.
Use document locations for a different question
When present, locations indicates where the error occurred in the GraphQL document. Keep that document available so the diagnostic can be investigated in context.
If an error has no path, inspect its message and any document locations. Check what information they provide about the operation, and record that the response did not supply a path. An invented path would make the investigation look more certain than the evidence allows.
Explain why a parent field can become null
A null parent needs an explanation tied to the schema and the server’s execution rules. The supported starting point is that returning null for a field with a Non-Null output type can raise a field error. Explaining how that error affects containing fields requires checking the applicable propagation rule.
Synthetic observation: example D
Consider this response as an observation to investigate, rather than an expected output derived from a schema:
{
  "data": {
    "report": null
  },
  "errors": [
    {
      "message": "A required report value was unavailable.",
      "path": ["report", "title"]
    }
  ]
}
The returned report value is null, while the diagnostic retains additional path entries. Preserve both details. To determine whether a child failure explains the parent value, assemble the following evidence:
| Evidence to obtain | Question it should answer |
|---|---|
| The actual operation | Which report fields were requested? |
| The output declaration for the suspected child | Is that field declared Non-Null? |
| The containing fields’ output declarations | Which enclosing fields permit null? |
| The applicable execution documentation | How does this error affect containing fields, and where does that effect stop? |
Only after those checks should you write a schema-qualified explanation or fix an expected response in a test. Apply the same process when the observed response contains "data": null: confirm the full chain of declarations and the governing rule before attributing that outcome to a particular child.
The useful inspection habit is to keep detailed diagnostics even when the returned tree offers fewer nested values to examine.
Identify useful surviving data
Partial data deserves an application-level review. A field error does not automatically make every returned value irrelevant: GraphQL attempts to continue other fields, and the deletion example retains the first deletion’s returned identifier even though the second deletion fails.
For example B, separate the immediate task into decisions supported by the response:
| Application question | Available evidence | Remaining work |
|---|---|---|
| What identifier did the first deletion return? | firstDelete.id contains item-17. |
Check whether the application needs additional confirmation. |
| Did the response report a problem with the second deletion? | The error message says the second deletion failed. | Investigate the cause and determine an appropriate recovery action. |
| Does this response establish that the entire requested task completed? | It contains a surviving result and a failure diagnostic. | Resolve the failed part and any other required dependencies. |
A useful display or investigation note can retain the first identifier alongside the second deletion’s error. That preserves the relationship between what returned and what remains unresolved.
Before repeating an action, establish what has already completed and what the application still needs. The returned identifier is evidence worth carrying forward into that decision. Also consider dependencies: a surviving value may answer a narrow question while still being insufficient for a larger workflow that requires the missing result.
Interpret HTTP context alongside the response body
Record the observed HTTP status and response media type with the body. These details help describe the exchange accurately, while the body supplies the returned operation result and error information.
Even when the HTTP exchange appears successful, open the response object and inspect its contents. The status alone does not show which values are present, how many errors were returned, or whether the application’s required fields are available.
A compact inspection record can contain:
| Item | What to record |
|---|---|
| HTTP status | The exact observed status. |
| Response media type | The observed Content-Type value, or that it was unavailable. |
| Data property | Whether it is absent, explicitly null, or contains a result. |
| Errors | Every returned entry and its diagnostic details. |
| Additional metadata | Any returned extensions object and other observed properties. |
Keep conclusions specific to the exchange and the server guidance you have verified. If you need to decide whether a particular status or media type is expected, consult that server’s documentation. A formatted JSON body alone cannot establish its HTTP response policy.
When sharing a debugging example, keep transport observations adjacent to the preserved body so another reader can assess both parts of the same exchange.
Repeat the inspection consistently
Use the same sequence for each response so that formatting, diagnosis, and application decisions remain connected:
- Retain the original response and the operation that produced it.
- Record the observed HTTP status and media type.
- Format the complete JSON object in escentmachine.
- Check that every value, error entry, and additional metadata property survived formatting.
- Inspect
dataanderrorstogether, distinguishing an absent property from an explicit null. - Read every error message and any document locations.
- Investigate each supplied path using verified alias and list conventions.
- Check schema nullability and the applicable propagation rule where missing or null values need explanation.
- Identify useful returned values, unresolved dependencies, and the next evidence needed.
Expected observations from the examples
| Example | Observation to carry forward |
|---|---|
| A: successful response | The returned object contains the illustrated identifier and no error entries. |
| B: partial response | The first deletion’s identifier survives alongside the second deletion’s failure diagnostic. |
| C: request error before execution | The response contains an error and omits the data property. |
| D: null parent observation | The parent is null and diagnostic path details remain; the causal explanation requires schema and execution-rule checks. |
| B after formatting | Indentation changes while values, diagnostics, and extension metadata remain intact. |
Finish an inspection with a concise finding: what the response returned, what failed, which interpretation has been verified, and what remains unresolved. This gives the next debugging step a clear purpose and keeps useful results visible throughout the investigation.